Personalized Services

Turn data into smart decisions with our data analytics, science, and visualization services.

Automated Spreadsheets
A three-dimensional Microsoft Excel icon with a stylized 'X' prominently displayed in the center. The icon is floating against a dark green background, creating a sense of depth and modernity.

Create spreadsheets in Excel and Google Sheets to optimize your work and increase productivity.

graphs of performance analytics on a laptop screen
A laptop displaying a financial dashboard with various stock market graphs and data. The screen shows different stock indices and their performance, including line charts and a bar chart for market overview. The laptop is placed on a light-colored table, and a gray sofa is visible in the background.
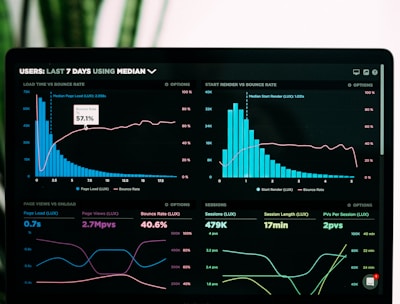
Business Inteligence

Development of dashboards in Power BI and Looker Studio for clear and effective visualization of your data.

Custom Projects

Customized solutions to meet your specific data analytics and data science needs.

Portfolio

Explore spreadsheet and dashboard projects, and soon, data science and analytics.

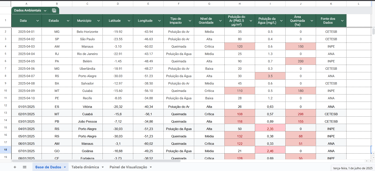
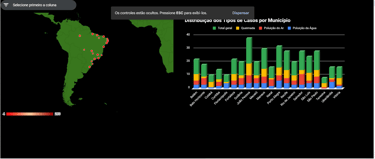
Spreadsheet for environmental control

Helping environmental protection companies and NGOs monitor conservation data and receive alerts about registered problems

Spreadsheets Models

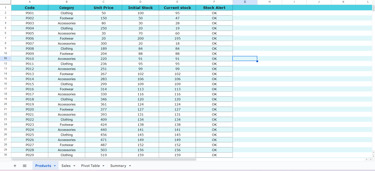
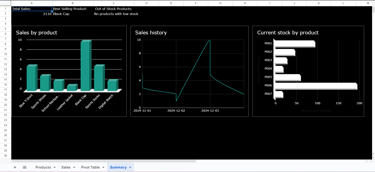
Sales and Inventory Control

Easily manage your sales and inventory with this practical and efficient spreadsheet! Designed for small businesses, physical shops, freelancers, and digital entrepreneurs who need a simple tool to track their commercial operations.

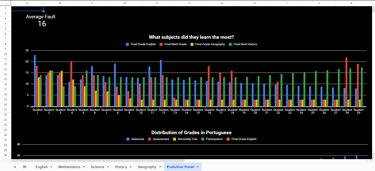
Note Organizer for Elementary School Teacher

This spreadsheet is specially designed for elementary school teachers who want to save time, track student progress, and keep everything neatly organized in one place.

Customer Reviews

See what our customers say about our data services.

Datalo's service transformed our data into valuable insights and quick decisions.

Maria Silva
A person is looking at a computer screen displaying a document titled 'Overview - All Private Equity - Fundraising, Investments, & D'. The document contains statistical charts and graphs related to private equity market statistics from 2007 to 2022. Various tabs and functions like 'File', 'Home', 'Insert', and 'Design' are visible in the interface.

São Paulo

The work was exceptional, delivering interactive dashboards that facilitated our data analysis and improved our strategic decision-making.

A laptop displays a detailed financial chart with lines showing data trends. In the background, a person is partially visible, wearing a dark shirt with the words 'most valuable' and some logos printed on it. The setting appears to be a modern workspace.
João Souza

Rio Janeiro

★★★★★
★★★★★