Serviços Personalizados

Transforme dados em decisões inteligentes com nossos serviços de análise, ciência e visualização de dados.

Planilhas Automatizadas
A three-dimensional Microsoft Excel icon with a stylized 'X' prominently displayed in the center. The icon is floating against a dark green background, creating a sense of depth and modernity.

Criação de planilhas em Excel e Google Sheets para otimizar seu trabalho e aumentar a produtividade.

graphs of performance analytics on a laptop screen
A laptop displaying a financial dashboard with various stock market graphs and data. The screen shows different stock indices and their performance, including line charts and a bar chart for market overview. The laptop is placed on a light-colored table, and a gray sofa is visible in the background.
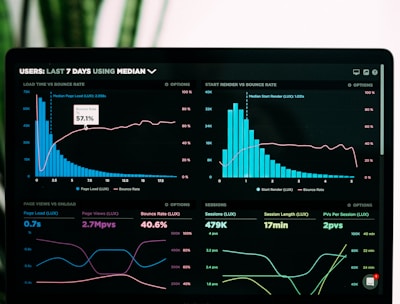
Dashboards Interativos

Desenvolvimento de dashboards no Power BI e Looker Studio para visualização clara e eficaz de seus dados.

Projetos Sob Medida

Em Breve!
Soluções personalizadas para atender às suas necessidades específicas de análise de dados e ciência de dados.

Portifólio

Explore projetos de planilhas e dashboards e em breve ciência e análise de dados.

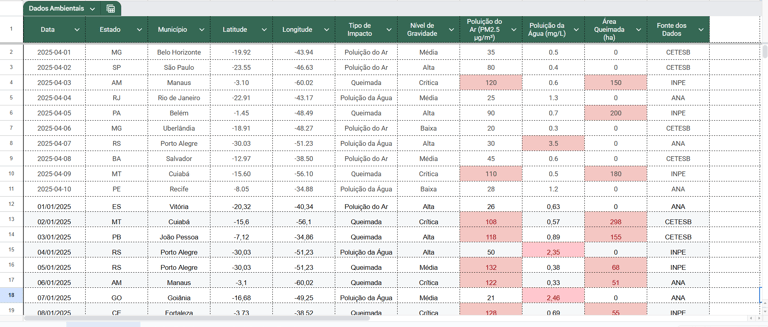
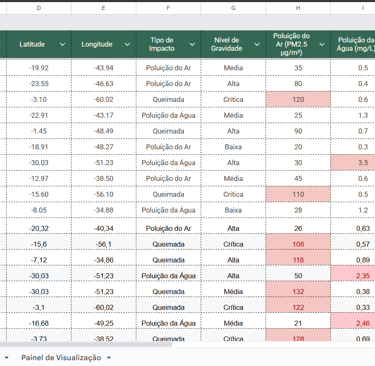
Planilha para controle ambiental

Ajuda de empresas e ONGs de protenção ambiental a monitorarem dados de preservação e receber alertas sobre problemas registrados

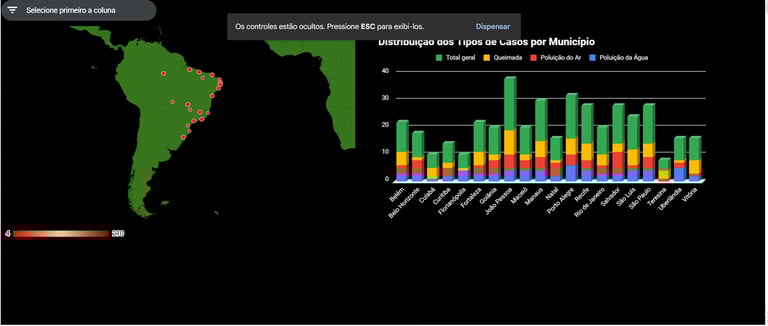
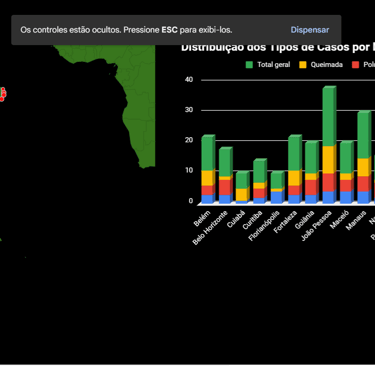
Dashboard para a exibição de dados

Exibe os principais KPIs das áreas ambientais monitoradas na planilha para tomada de decisão rápida e intuitiva

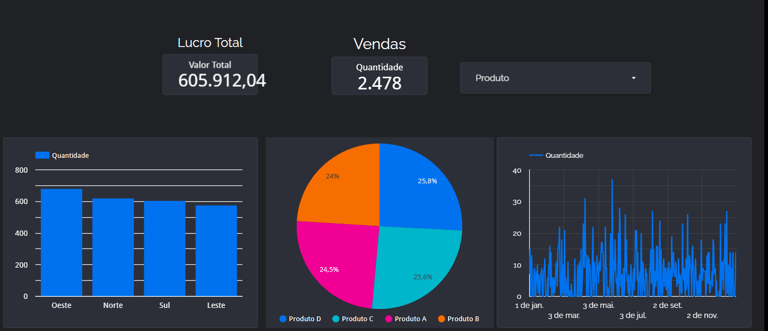
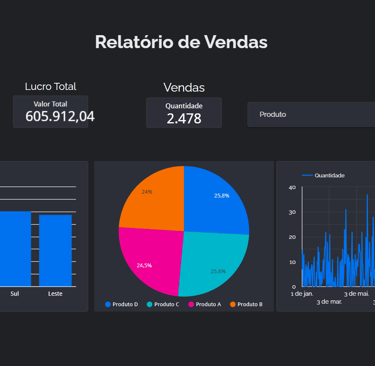
Dashboard vendas com filtros em tempo real

Feito no Looker Studio, permite visualização interativa das vendas com filtros por período, categoria e região. Permite acompanhar metas, desempenho de produtos e evolução diária com clareza e agilidade.

Avaliações Clientes

Veja o que nossos clientes dizem sobre nossos serviços de dados.

O serviço da datalo transformou nossos dados em insights valiosos e decisões rápidas.

Maria Silva
A person is looking at a computer screen displaying a document titled 'Overview - All Private Equity - Fundraising, Investments, & D'. The document contains statistical charts and graphs related to private equity market statistics from 2007 to 2022. Various tabs and functions like 'File', 'Home', 'Insert', and 'Design' are visible in the interface.

São Paulo

O trabalho foi excepcional, entregando dashboards interativos que facilitaram nossa análise de dados e melhoraram nossa tomada de decisões estratégicas.

A laptop displays a detailed financial chart with lines showing data trends. In the background, a person is partially visible, wearing a dark shirt with the words 'most valuable' and some logos printed on it. The setting appears to be a modern workspace.
João Souza

Rio Janeiro

★★★★★
★★★★★