Projetos Personalizados

Transformamos dados em decisões inteligentes com soluções sob medida.

A computer screen displays a financial dashboard with stock market data, including indices like S&P 500 and NASDAQ, along with commodities like gold prices. A red line graph shows a declining trend, indicating negative market performance.
Dashboards Interativos

Visualizações dinâmicas para insights rápidos e eficazes.

A laptop on a wooden desk displays a web application interface featuring graphs and statistics. Beside it, a large monitor shows a webpage promoting an all-in-one meeting app. A cup with a recognizable green and white logo sits on the desk.
Planilhas Automatizadas

Facilitamos sua análise de dados com Excel personalizado.

A person with a striped shirt and a cap is standing in front of a computer screen displaying data and analytics. Another laptop is open on a desk below the monitor, and a large metallic tank with a pressure gauge is nearby.
A person is holding a smartphone displaying an analytics or insights screen with various metrics and numbers. The individual is wearing a casual white shirt and a watch with a black band. The surrounding environment includes an indoor plant.
Consultoria Personalizada

Projetos personalizados que atendem às suas necessidades específicas.

Em Breve!
Análise de Dados e Ciência de Dados

Serviços que transformam dados brutos em informações valiosas.

Detailed map displaying data visualization with blue circular markers representing specific data points across a geographical area labeled with city names such as Lisbon and Evora. Bold, brightly colored numerical statistics appear on the left side with the terms 'Suspeitos' and 'Amostras,' suggesting a context of data tracking or analysis.

Projetos

Transforme dados em decisões inteligentes com nossos serviços personalizados.

Two people are sitting at a wooden table, engaging in a discussion. A laptop is open, displaying a statistical dashboard with charts and a world map. Several smartphones and notepads are scattered on the table. The focus is on the person's hand gesturing in conversation, indicating active engagement.
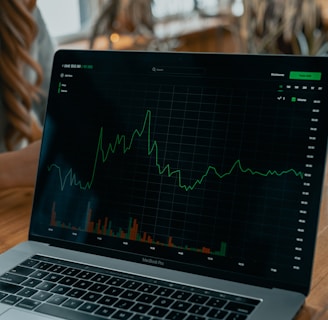
A laptop displaying a line graph with various peaks and troughs on its screen, indicating stock or financial data. The graph and numbers are green against a black background. The laptop is placed on a wooden table, and beside it, a person's arm is partially visible.
A SWOT analysis chart is displayed on a whiteboard, divided into four quadrants. Each section is labeled in Spanish: 'Debilidades' (weaknesses), 'Amenazas' (threats), 'Fortalezas' (strengths), and 'Oportunidades' (opportunities). The central circle contains the letters D, A, F, and O corresponding to the initials of these words. The text is colored in red, green, and blue.

Avaliações Clientes

Veja o que nossos clientes dizem sobre nossos serviços personalizados.

O trabalho da datalo transformou nossos dados em insights valiosos e decisões eficazes.

João Silva
A close-up view of the dashboard in a car, focusing on the analog dials. The dials have black backgrounds with orange and white indicators, showing various measurements. The lighting suggests a dimly lit or shadowed environment, highlighting the curvature and material texture of the dashboard.

São Paulo

A equipe da datalo entregou um dashboard incrível que facilitou nossa análise de dados e melhorou nossa tomada de decisões.

Detailed financial data presented in a tabular format, including company names such as Dow Inc., Caterpillar, and 3M. Various metrics and statistics are displayed, along with changes in value highlighted in green and red.
Maria Costa

Rio Janeiro

★★★★★
★★★★★